
Senior Partner | Principal


October 2020
While still below January’s pre-pandemic level, the U.S. economy has made great progress since the lifting of lockdowns and restrictions. Yet today’s economy is far from normal and, in many ways, is quite abnormal. The rapid closing and reopening of large swaths of the nation’s economy, combined with massive government support, has caused numerous distortions not seen in normal times. For example: Home sales are booming despite high unemployment. Government bond yields are at record lows despite a flood of newly issued debt. And many online and so-called essential retailers have seen their sales soar while others deemed nonessential have filed for bankruptcy.
Behind these and many other distortions is a certain logic; but they are distortions nonetheless. And their existence has created a large divide between the economy’s winners and losers. For investors, this divide has caused wide performance dispersion across the stock market.
The S&P 500® Index rose to an all-time record high in August, giving the appearance that the U.S. stock market had fully recovered from its pandemic-triggered decline. Yet, a deeper look at the stock market reveals that, just like the economy, the stock market is far from fully recovered.
As shown in Chart 1, many larger and faster growing companies, as reflected by the Russell 1000 Growth Index, have not only recovered, but have performed quite well this year, as some actually benefited from work-from-home and other pandemic-related changes. It is primarily that group of stocks that propelled the S&P 500® Index to its gains.
Outside that group, gains have been harder to find. In fact, indexes representing small, mid-sized, higher-dividend-yielding, and value-leaning stocks were all trading lower on the year through mid-September.
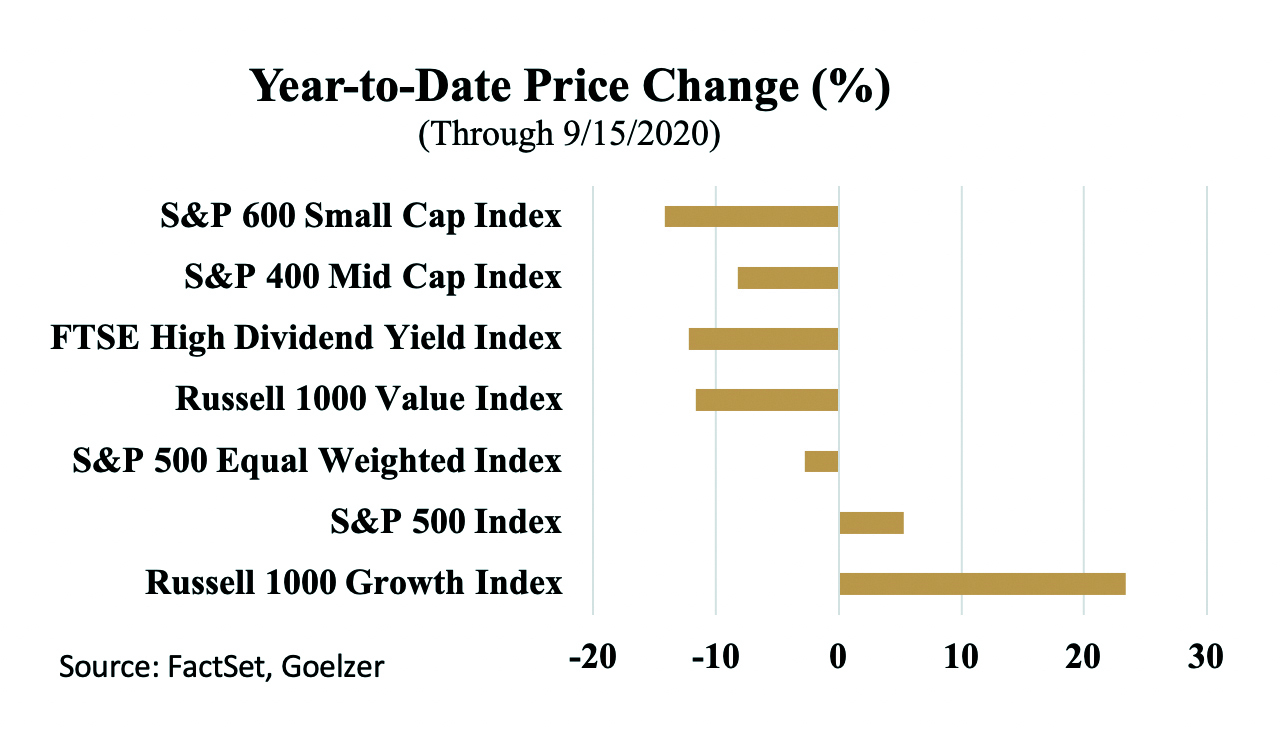
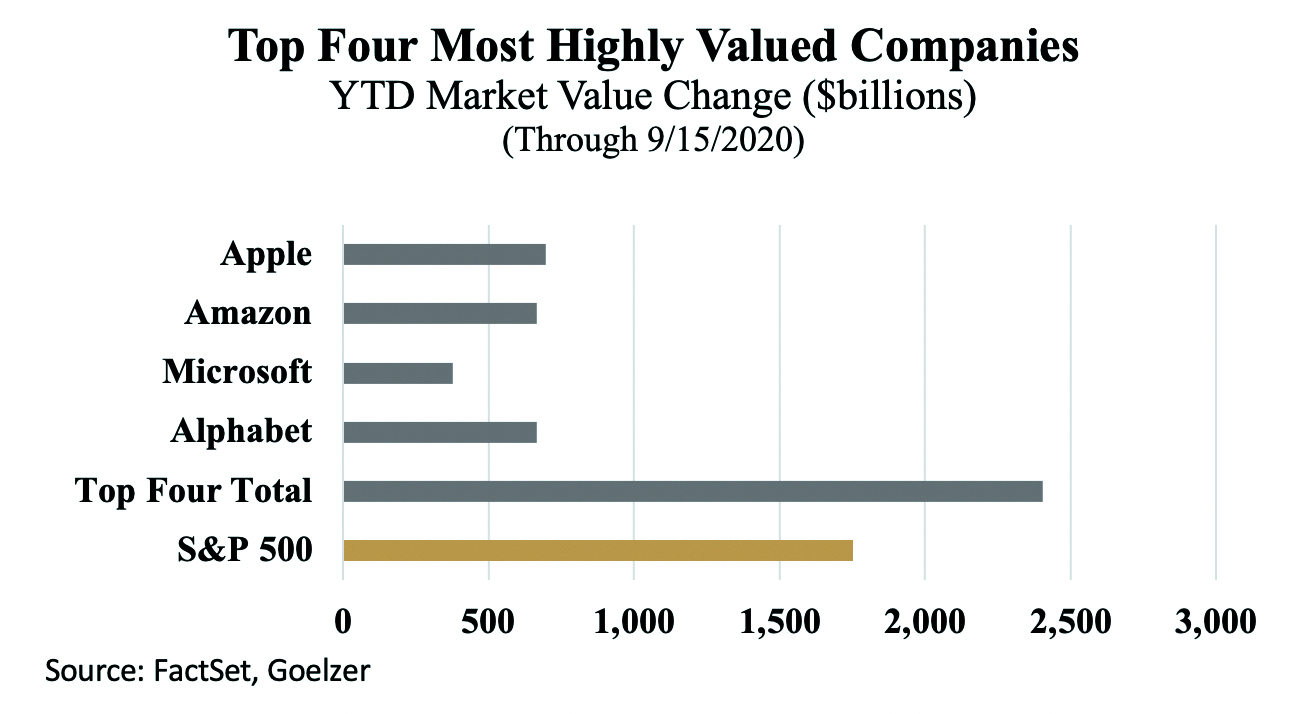
Also shown on the chart, the S&P 500® Equal Weighted Index was lower on the year. The difference between this index and the more commonly followed S&P 500® Index is that the member stocks are each weighted equally instead of by market capitalization. Therefore, larger companies don’t have an outsized influence on the index’s returns. This year, larger companies have had a dominant influence on the S&P 500® Index’s return. As shown in Chart 2, the combined increase in market capitalization for the S&P 500® Index’s four largest member companies exceeds that of the index in total. In other words, the index’s remaining member stocks provided a combined loss this year through mid-September.
Another example of the stock market’s wide performance dispersion can be seen in the broader S&P 1500® Index. As of mid-September, the index had risen by 3.9% year to date, but the median performing stock in the index had fallen by 13%, while a full two-thirds of the index’s 1,500 member stocks had declined in price.1
Investing in companies that benefited from or were less affected by the pandemic has proven to be a winning strategy this year versus owning a more broadly diversified stock portfolio. But will that continue to be the case?
The answer to that question depends on the answer to another question: Will every year be like this year? For many reasons, we certainly hope not, nor do we expect so. Therefore, our answer to both questions is “no.”
We see the economy continuing its rebound into next year, although at a slower pace than in recent months. In addition, we see the recovery broadening to include more industries. Because of that, we anticipate that stock performance will broaden as well, rewarding investors with more diversified stock portfolios. Earnings growth will be the key to broadening the stock market’s performance. Looking to 2021, projected earnings growth favors small and mid-sized companies over large companies with recession-depressed earnings expected to rebound by 83%, 48%, and 26% for the respective S&P indexes.2Additionally, value sectors such as energy, industrials, and financials are forecast to have higher 2021 earnings growth than growth sectors including technology and healthcare.3Should these earnings projections prove to be at least directionally correct, the dominant performance of this year’s leaders versus other groups will likely fade.
When this rotation will begin is impossible to predict. However, it may have already started. Since early July, the performance of small, mid, and value stock indexes has led the Russell 1000 Growth Index. 4Only time will tell whether that marks the beginning of a fuller recovery for both the economy and the stock market.
1The S&P 1500® Index comprises the S&P 500® Index, the S&P 400 Mid Cap Index, and the S&P 600 Small Cap Index. Price performance is as of September 15, 2020.
2FactSet.
3FactSet, Earnings Insight—September 18, 2020
4Price returns July 9, 2020 through September 18, 2020: Russell 1000 Growth Index +3.8%, Russell 1000 Value Index +7.7%, S&P 400 Mid Cap Index +6.7%, and S&P 600 Small Cap Index +8.8%.
