
Senior Partner | Principal


Investors have been through a volatile multi-year stretch. The combination of a worldwide pandemic and erratic monetary policy led to 20% or greater declines for U.S. stock prices in three of the past five years.1 And over the past 12 months, accelerated interest rate increases by the Federal Reserve meant negative returns for stocks and bonds. In fact, at the 2022 lows, a traditional portfolio of 60% U.S. stocks and 40% U.S. bonds had fallen by more than 20%.2
It seems that weary investors, having endured all that volatility, should be due for some reward. And we think we’ve found it. According to our updated capital market expectations, that reward comes in the form of higher expected long-term returns when compared to our projections at the end of last year.
As shown in Chart 1, our 10-year forward-return projections have increased significantly from late 2021—a time when our projections were the lowest since the end of the 1990’s dot-com bubble. On average, our expected annualized 10-year returns for stocks increased by 3.5 percentage points over the prior year and our bond return expectations increased by 2 percentage points.

Our stock return forecasts apply reversion-to-the-mean calculations to arrive at our results. Declines in stock prices throughout 2022 accelerated the reversion process, pushing price-earnings multiples sharply lower toward their long-term averages. This re-rating of stock multiples accounts for the majority of our improved expected returns across all stock indexes. International equity return estimates also benefit from reversion-to-the-mean for the U.S. dollar, which rose over the past year.
Higher starting yields across the yield curve drive our increased bond-return expectations by providing both income support to returns and increased capital appreciation potential over last year’s forecasts. Projected returns for both corporate and municipal bonds also benefit from increased yield spreads relative to U.S. Treasury securities.
Note that for each asset class we show both our mean return forecast and a range that we call uncertainty intervals. Assets classes with less volatile valuation changes have smaller ranges, or greater certainty, than those that have exhibited more volatile valuation changes. Through the process of forming capital market expectations, we strive to produce useful longer-term forecasts, knowing that perfect forecasts are impossible to achieve. However, more important than predicting exact returns for each asset class is predicting relative returns across asset classes. That is key to good asset allocation decisions.
We realize that despite our improved long-term return forecasts, many of you may feel hesitant to invest new monies due to ongoing concerns about inflation, Federal Reserve policy, and possible recession. But while today’s environment may seem particularly uncertain, investors’ fear of a near-term market decline is common at most times.
One way to manage that fear is to spread out the investment of new cash over multiple weeks or months. This approach brings emotional comfort by knowing that, if the markets were to suddenly decline, you will have participated with only a portion of your new cash. Investors most commonly use this method for new investments into stocks due to their high level of short-term price volatility.
But when deciding whether to invest new cash all at once or over an extended period, it is important to inform your decision by knowing what the base case is for stock prices over such periods. To provide an example, we researched rolling 6-month returns for the Standard & Poor’s 500® Index dating back to 1970 to determine the probability of stock prices rising versus falling.
Our research is summarized in Chart 2, which shows that stocks prices were far more likely to rise over 6-month periods, with nearly 70% of the periods ending higher. Therefore, by a wide margin it was typically better to invest at the beginning of the period than the end.
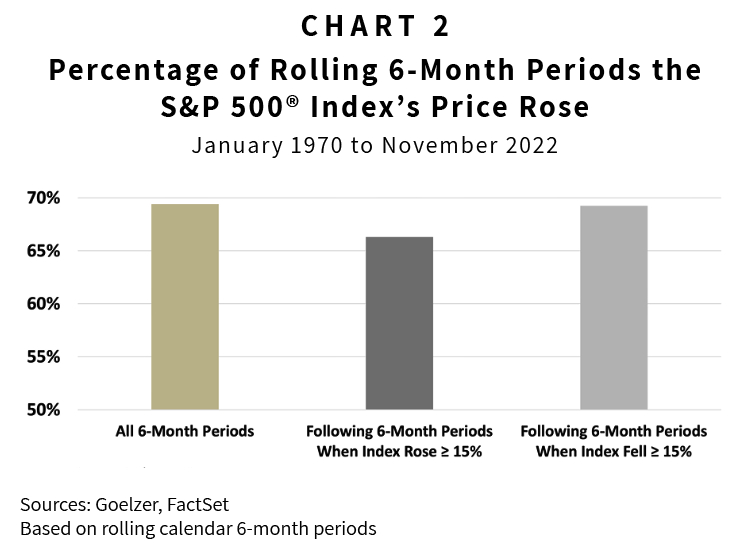
These results led us to wonder if significant price changes during preceding 6-month periods would affect the outcomes. Specifically, we wanted to know if stock prices were more, or less, likely to rise following significant price gains and declines. We defined significant stock price changes as gains or losses of 15% or greater. Surprisingly, such significant price movements had little effect on the probability of stock prices rising during the subsequent six months. Stock prices rose during 66% of 6-month periods following a significant price increase and in 69% of periods following significant price declines.
While our research doesn’t tell you what stock prices will do over the next six months, it informs your decision on when to invest new monies by providing a historical base case. Additionally, it illustrates the greater randomness of stock price movements over shorter versus longer periods. Significant price movements had little effect on the odds of stock prices rising over the subsequent six months. However, significant price movements can have a large effect on longer-term returns as shown by the positive effect of the past year’s price declines on our 10-year return projections.
1 Based on the Standard & Poor’s 500® Index using intraday lows.
2 60% Standard & Poor’s 500® Index and 40% Bloomberg U.S. Aggregate Bond Index
The following indexes are used in our forecasting models to represent various asset classes: S&P 500® Index, U.S. large cap stocks; Russell 1000 Growth Index, U.S. large cap value stocks; Russell 1000 Value Index, U.S. large cap growth stocks; S&P 600 Mid Cap Index, U.S. mid cap stocks; S&P 400 Small Cap Index, U.S. small cap stocks; MSCI ACWI ex-US, World ex-U.S. stocks; Bloomberg U.S. Aggregate Bond Index, U.S. taxable bonds, Bloomberg U.S. High Yield Bond Index, U.S. high yield corporate bonds; Credit Suisse Hedge Fund Index, Liquid Alternatives.
DISCLAIMER: The information provided in this piece should not be considered as a recommendation to buy, sell or hold any particular security. This report includes candid statements and observations regarding investment strategies, individual securities, and economic and market conditions; however, there is no guarantee that these statements, opinions, or forecasts will prove to be correct. Actual results may differ materially from those we anticipate. The views and strategies described in the piece may not be suitable to all readers and are subject to change without notice. You should not place undue reliance on forward-looking statements, which are current as of the date of this report. The information is not intended to provide and should not be relied on for accounting, legal, and tax advice or investment recommendations. Investing in stocks involves risk, including loss of principal. Past performance is not a guarantee of future results.
ABOUT GOELZER: With over 50 years of experience and more than $2.5 billion in assets under advisement, Goelzer Investment Management is an investment advisory firm that leverages our proprietary investment and financial planning strategies to help successful families and institutions Dream, Invest, and Live.
