
Senior Partner | Principal


January 2022
—DAVID BOWIE
We have made it our practice to begin each year with an update of our 10-year stock and bond market return forecasts. We undertake this exercise to provide reasonable expectations for financial planning and asset allocation decisions. This past year we put considerable effort into refining our forecasting models while also broadening our coverage of asset classes.
While pleased with our new models, we realize that no one knows the future and that no model can predict future market returns with perfect accuracy. But with history as a guide, we believe it is possible to make useful, if not perfect, longer-term return forecasts. More important than predicting exact returns, however, is predicting relative returns across asset classes. That is key to good asset allocation decisions.
Our asset class forecast models do not try to predict the economy, politics, or major events that might affect returns. As we have learned, the more predictions required, the more opportunity for errors. Rather, we take data that are already known and apply regression-to-the-mean calculations to arrive at our results. For example, our stock market forecasts take the past 20 years of corporate earnings and project that those earnings will follow a similar trend forward for the next 10 years. We combine this calculation with an estimate of the stock market’s equilibrium valuation, based both on median historical valuations and projected interest-rate levels, to arrive at our total-return forecasts. This method has provided reasonable and directionally useful results historically.
Before looking at our projected 10-year returns, let’s first review some of the history affecting our projections by examining returns from stock and bond markets over the past 10 years. As measured by the S&P 500® Index, the U.S. stock market just completed its best 10-year period since 2000 and its seventh highest since the index’s inception in 1957.1 The annualized total return for the period was 16.5%, well above the median 10-year annualized return of 9.6%. The U.S. bond market, as measured by the Bloomberg U.S. Aggregate Bond Index, did not fare as well. Its 10-year annualized total return was just 2.9%, well below the median 10-year return of 7.2% and the lowest return since the index’s inception in 1976.
The low and falling interest rates that suppressed bond returns over the past ten years contributed to stock returns by lifting valuations during the period. That was great for stock investors. But unfortunately, that comes with a cost of lower return projections going forward.
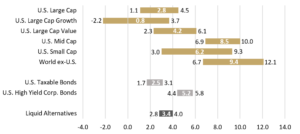
The chart above shows our 10-year return forecasts for various classes of stocks, bonds, and alternative assets. For each asset class we provide a range of outcomes centered around the mean return forecasted by our models. Note that the size of the ranges varies by asset class based on historical volatility and other factors. For example, valuations for U.S. small cap stocks have historically been more volatile than those of U.S. large cap stocks, causing our return range to be wider.
The following are some observations worth noting:
Critical to using these forecasts for planning and setting asset allocation policies is knowing not only the mean return forecast but also the size of the bands. These bands are similar to what scientists call uncertainty intervals. Assets classes with less volatile valuation changes have smaller bands, or greater certainty, than those that have exhibited more volatile valuation changes. Because of this, it is possible for one asset class to have a higher forecasted mean return than another, yet a smaller return at the low end of its band. Therefore, simply allocating your portfolio to the asset class with the highest forecasted mean return may not result in the best outcome.
For readers concerned about our low forecasts for some asset classes, we offer one important reminder: all forecasts are based on one point in time and do not account for the likelihood of economic recession or market downturns over the forecast period. While unpleasant, these events are likely to be part of the path to 10-year returns and will offer better starting points that could produce higher market returns. A well-crafted, strategic investment plan—combined with disciplined portfolio rebalancing—is critical to seizing such opportunities.
1 Based on 10-year periods beginning at the start of each calendar year.
The following indexes are used in our forecasting models to represent various asset classes: S&P 500 Index, U.S. large cap stocks; Russell 1000 Growth Index, U.S. large cap value stocks; Russell 1000 Value Index, U.S. large cap growth stocks; S&P 600 Mid Cap Index, U.S. mid cap stocks; S&P 400 Small Cap Index, U.S. small cap stocks; MSCI ACWI ex-US, World ex-U.S. stocks; Bloomberg U.S. Aggregate Bond Index, U.S. taxable bonds, Bloomberg U.S. High Yield Bond Index, U.S. high yield corporate bonds; Credit Suisse Hedge Fund Index, Liquid Alternatives.
DISCLAIMER: The information provided in this material should not be considered as a recommendation to buy, sell, or hold any particular security. This report includes candid statements and observations regarding investment strategies, individual securities, and economic and market conditions; however, there is no guarantee that these statements, opinions, or forecasts will prove to be correct. Actual results may differ materially from those we anticipate. The views and strategies described in the piece may not be suitable to all readers and are subject to change without notice. You should not place undue reliance on forward-looking statements, which are current as of the date of this report. The information is not intended to provide and should not be relied on for accounting, legal, and tax advice or investment recommendations. Investing in stocks involves risk, including loss of principal. Past performance is not a guarantee of future results.
