

Sustainable Spending Policy: What Nonprofits Should Know
Among the many decisions facing an investment committee, few are as critical as setting an appropriate spending policy. Comprising a set of rules to govern how a nonprofit will distribute its funds, a spending policy plays a crucial role in ensuring that a nonprofit can achieve its primary mission of supporting beneficiaries. Yet determining a prudent policy is challenging and varies by organization.
Essentially, crafting a prudent spending policy is a balancing act of many considerations, the primary of which include the following:
- Sustainability: Spending on beneficiaries today versus spending on beneficiaries tomorrow.
- Investment Risk & Reward: Balancing the need for short-term stability of the portfolio versus the desire for long-term growth.
- Consistency: Acceptance of wider annual disbursements versus more predictable annual amounts.
When reaching this delicate balance, organizations must thoughtfully establish both the spending method and the spending rate.
Spending Method
The spending method is the manner in which the annual spending amount will be calculated. Non-profits can use several approaches in making this calculation, each balancing the factors described above and combined to align with the organization’s mission. We have described some of the primary spending methods used by nonprofits in earlier Goelzer Insights pieces along with the benefits and considerations to each.1
For nonprofits seeking long-term, sustainable growth of their portfolios, we find the majority set their spending method based on spending a set percent of a moving average market value, also known as a market value method combined with a smoothing technique. A recent survey of endowments found that over 75% of institutions use this type of spending method, and, of those, the vast majority smoothed their market values over the last three years.2
Using a smoothing technique has some considerable benefits over the short and long term: 1) it stabilizes spending in down-market years; 2) it promotes more consistent annual spending; and, 3) it moderates near-term spending allowing for real, inflation-adjusted spending growth over time.
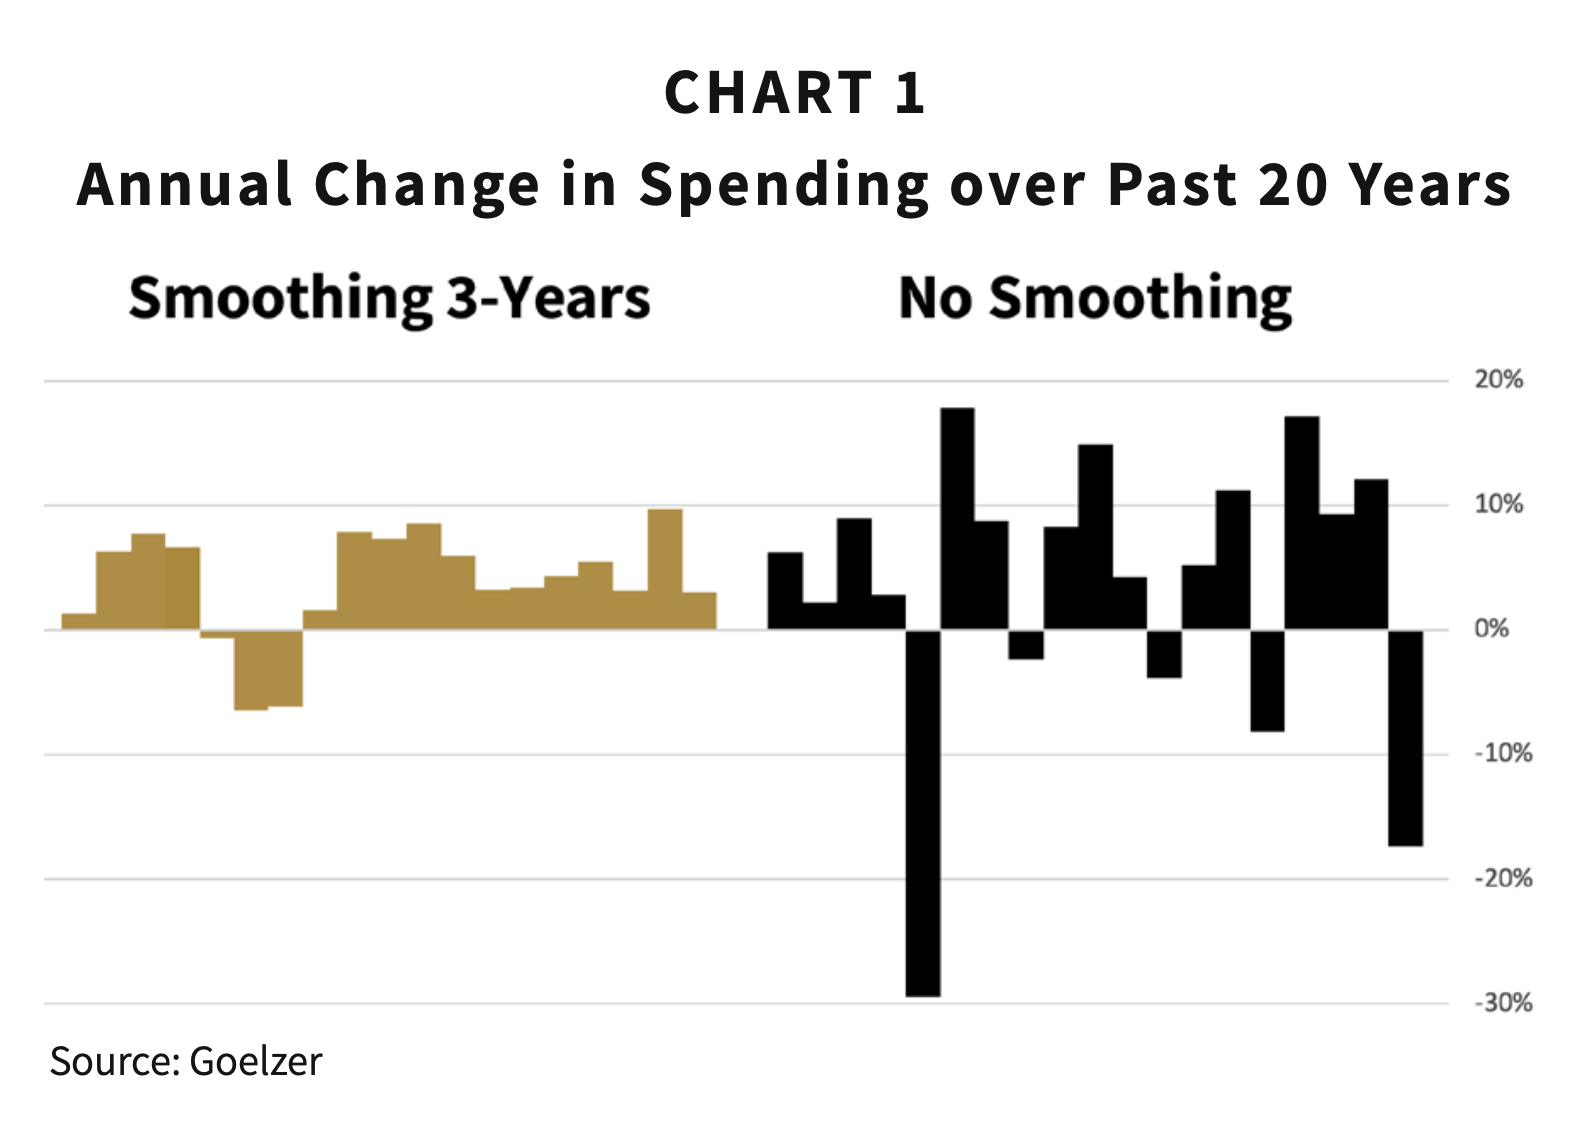
To earn real growth, nonprofits with investment portfolios positioned for the long-term must assume a certain level of short-term volatility. This volatility means there could be years where their portfolio will experience negative returns, practically speaking as much as -15%.3 This adversely impacts the allowable spending of organizations using the market value method without a smoothing technique. A 15% loss in market value means 15% less spending allowed next year.
Smoothing that loss, by combining it with prior years’ gains, mitigates the one-year impact and spreads the loss over time. The results are illustrated in Chart 1, which shows the percent change in spending of a hypothetical portfolio using the market value method with no smoothing versus a portfolio that uses a three-year smoothed market value method.
Spending Rate
After establishing the appropriate spending method, non-profit leaders should develop a prudent spending rate that reflects the organization’s objectives. The rate of spending is the largest factor in balancing the needs of today versus those of the future. Factors in setting the spending rate include the following:
| Spending Rate Factors | |
| Expected Portfolio Return | Long-term portfolio growth provides the majority of spending. Expected investment returns are driven by the asset allocation selected by the organization. |
| Expected Inflows | Additional and consistent fundraising can also support spending. |
| Expected Inflation | Organizations that wish to keep up with inflation—thus protecting their purchasing power—need to consider the deteriorating effect of inflation over the long-term. |
| Desired Real Growth | Growing the investment portfolio faster than simply keeping up with inflation supports spending greater amounts, in real terms, on future beneficiaries. |
Among these factors, sustainable spending is most directly tied to the expected long-term portfolio returns and the expected rate of inflation. Achieving a sustainable spending policy is akin to the “Goldilocks” scenario: spending not too much, not too little, but just right. Take a look at our hypothetical portfolio with a sustainable spending rate of 4.5% (expected return of 7.5% minus inflation of 3.0%).
As illustrated in Chart 2, spending at the sustainable rate (4.5%) provides the best opportunity for preserving purchasing power through time. $4.5 million spent today is roughly the same as spending $4.5 million in 20 years.
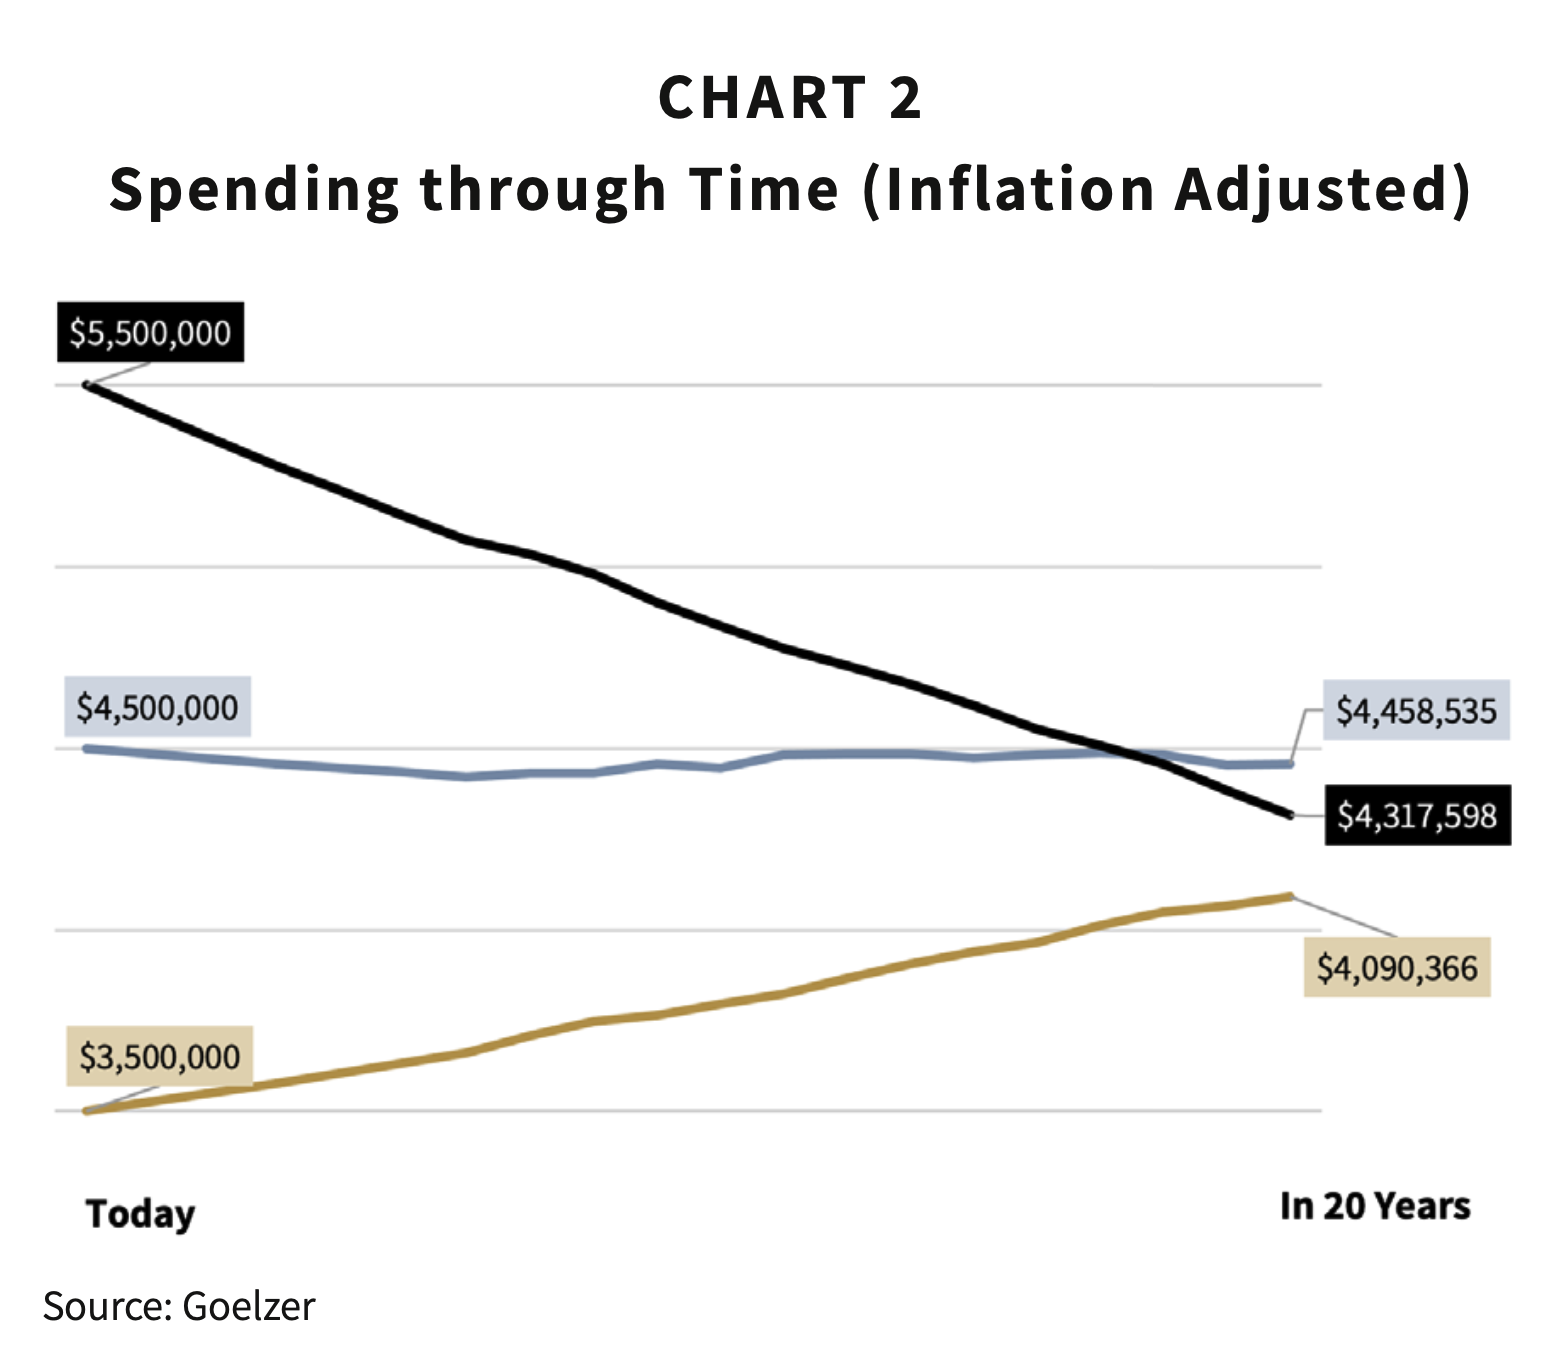
Spending more than the sustainable rate (5.5%) allows current beneficiaries to receive more to-day, $5.5 million but future beneficiaries receive far less, only $4.3 million, in year 20 with a continuing downward trajectory. While spending less than the sustainable rate (3.5%) both begins and ends with a lower annual spend relative to the “Goldilocks” spending rate of 4.5%.
Conclusion
Nonprofit leaders cannot make spending policy decisions on a stand-alone basis. Achieving the right balance between today and tomorrow is unique for every organization. Prudent organizations understand the delicate balance of each aspect and their related impacts, whether on current and future spending, future purchasing power (inflation), or the growth of the portfolio value. Regardless of the organization, Goelzer advocates documenting the spending policy and its rationale and then following it through time in a disciplined manner.
1 Gavin W. Stephens, Goelzer Insights, “Spending Guidelines for Institutional Investors,” 2019, https://goelzerinc.com/insights_post/spending-guidelines-for-institutional-investors-a-framework/.
2 Multiple methods per respondent were accepted. See NACUBO, 2022 NACUBO-Commonfund Study of Endowments, February 17, 2023, https://www.nacubo.org/Research/2022/NACUBO-Commonfund-Study-of-Endowments.
3 One-year negative return estimate is based on past experience of the Investment Metrics Endowment & Foundation Universe of Plans sized $50mm to $250mm. Over 50% of the plans in the universe lost -13% in 2022; -27% in 2008, and -5% in 2018.
DISCLAIMER: This report includes candid statements and observations regarding investment strategies; however, there is no guarantee that these statements or opinions will prove to be correct. Actual results may differ materially from those we anticipate. The views and strategies described in the piece may not be suitable to all readers and are subject to change without notice. The information is not intended to provide and should not be relied on for accounting, legal, and tax advice or investment recommendations. Investing in stocks involves risk, including loss of principal. Past performance is not a guarantee of future results.
