
Senior Partner | Principal


Much has been written about the U.S. stock market’s narrow performance this year—and for good reason. At its most extreme, five months into the year, all of the S&P 500 Index’s year-to-date total return, and more, could be attributed to just seven stocks.1 Not that other stocks didn’t rise during that period, many did. But seven stocks, due to a combination of large gains and large index weightings, had an outsized effect on the index’s performance: Apple, Microsoft, Alphabet, Amazon, Nvidia, Tesla, and Meta Platforms. Together, these stocks contributed ten percentage points to the S&P 500 Index’s 9.7% year-to-date total return through May, while the collective return of the remaining 493 stocks was negative.
During June, the stock market rose sharply and more stocks joined the rally. The seven stocks listed above accounted for over two-thirds of the S&P 500 Index’s 16.9% year-to-date total return at the year’s midpoint—less than at the end of May but still an unusually high proportion.
The stock market’s narrowness can also be seen through other popular indexes. For example, smaller company stocks have on average trailed this year as reflected by the S&P Small Cap 600 Index’s 6.0% return through June. And two indexes that seek to divide the stock market between faster-growing companies and lower-valued companies—the Russell 1000 Growth Index and the Russell 1000 Value Index—have provided dramatically different returns year to date. The Russell 1000 Growth Index, which benefited from holding six of the seven stocks mentioned above, provided a total return of 29.0%, while the Russell 1000 Value Index’s return was just 5.1%.2
The seven stocks credited with driving the S&P 500 Index’s return this year have several things in common. For one, each is among the S&P 500 Index’s ten largest stocks by market capitalization (price multiplied by the number of shares outstanding). Second, each declined more than the index during 2022, in many cases more than twice as much. And third, each is viewed as a company that will benefit from artificial intelligence—the stock market’s latest fixation.
A look back at recent history shows that this year’s stock-market performance reflects an acceleration of two trends that have been building over many years. One of these trends is the market’s increasing division between growth and value stocks. The second is the growing importance of the market’s largest companies to its overall performance.
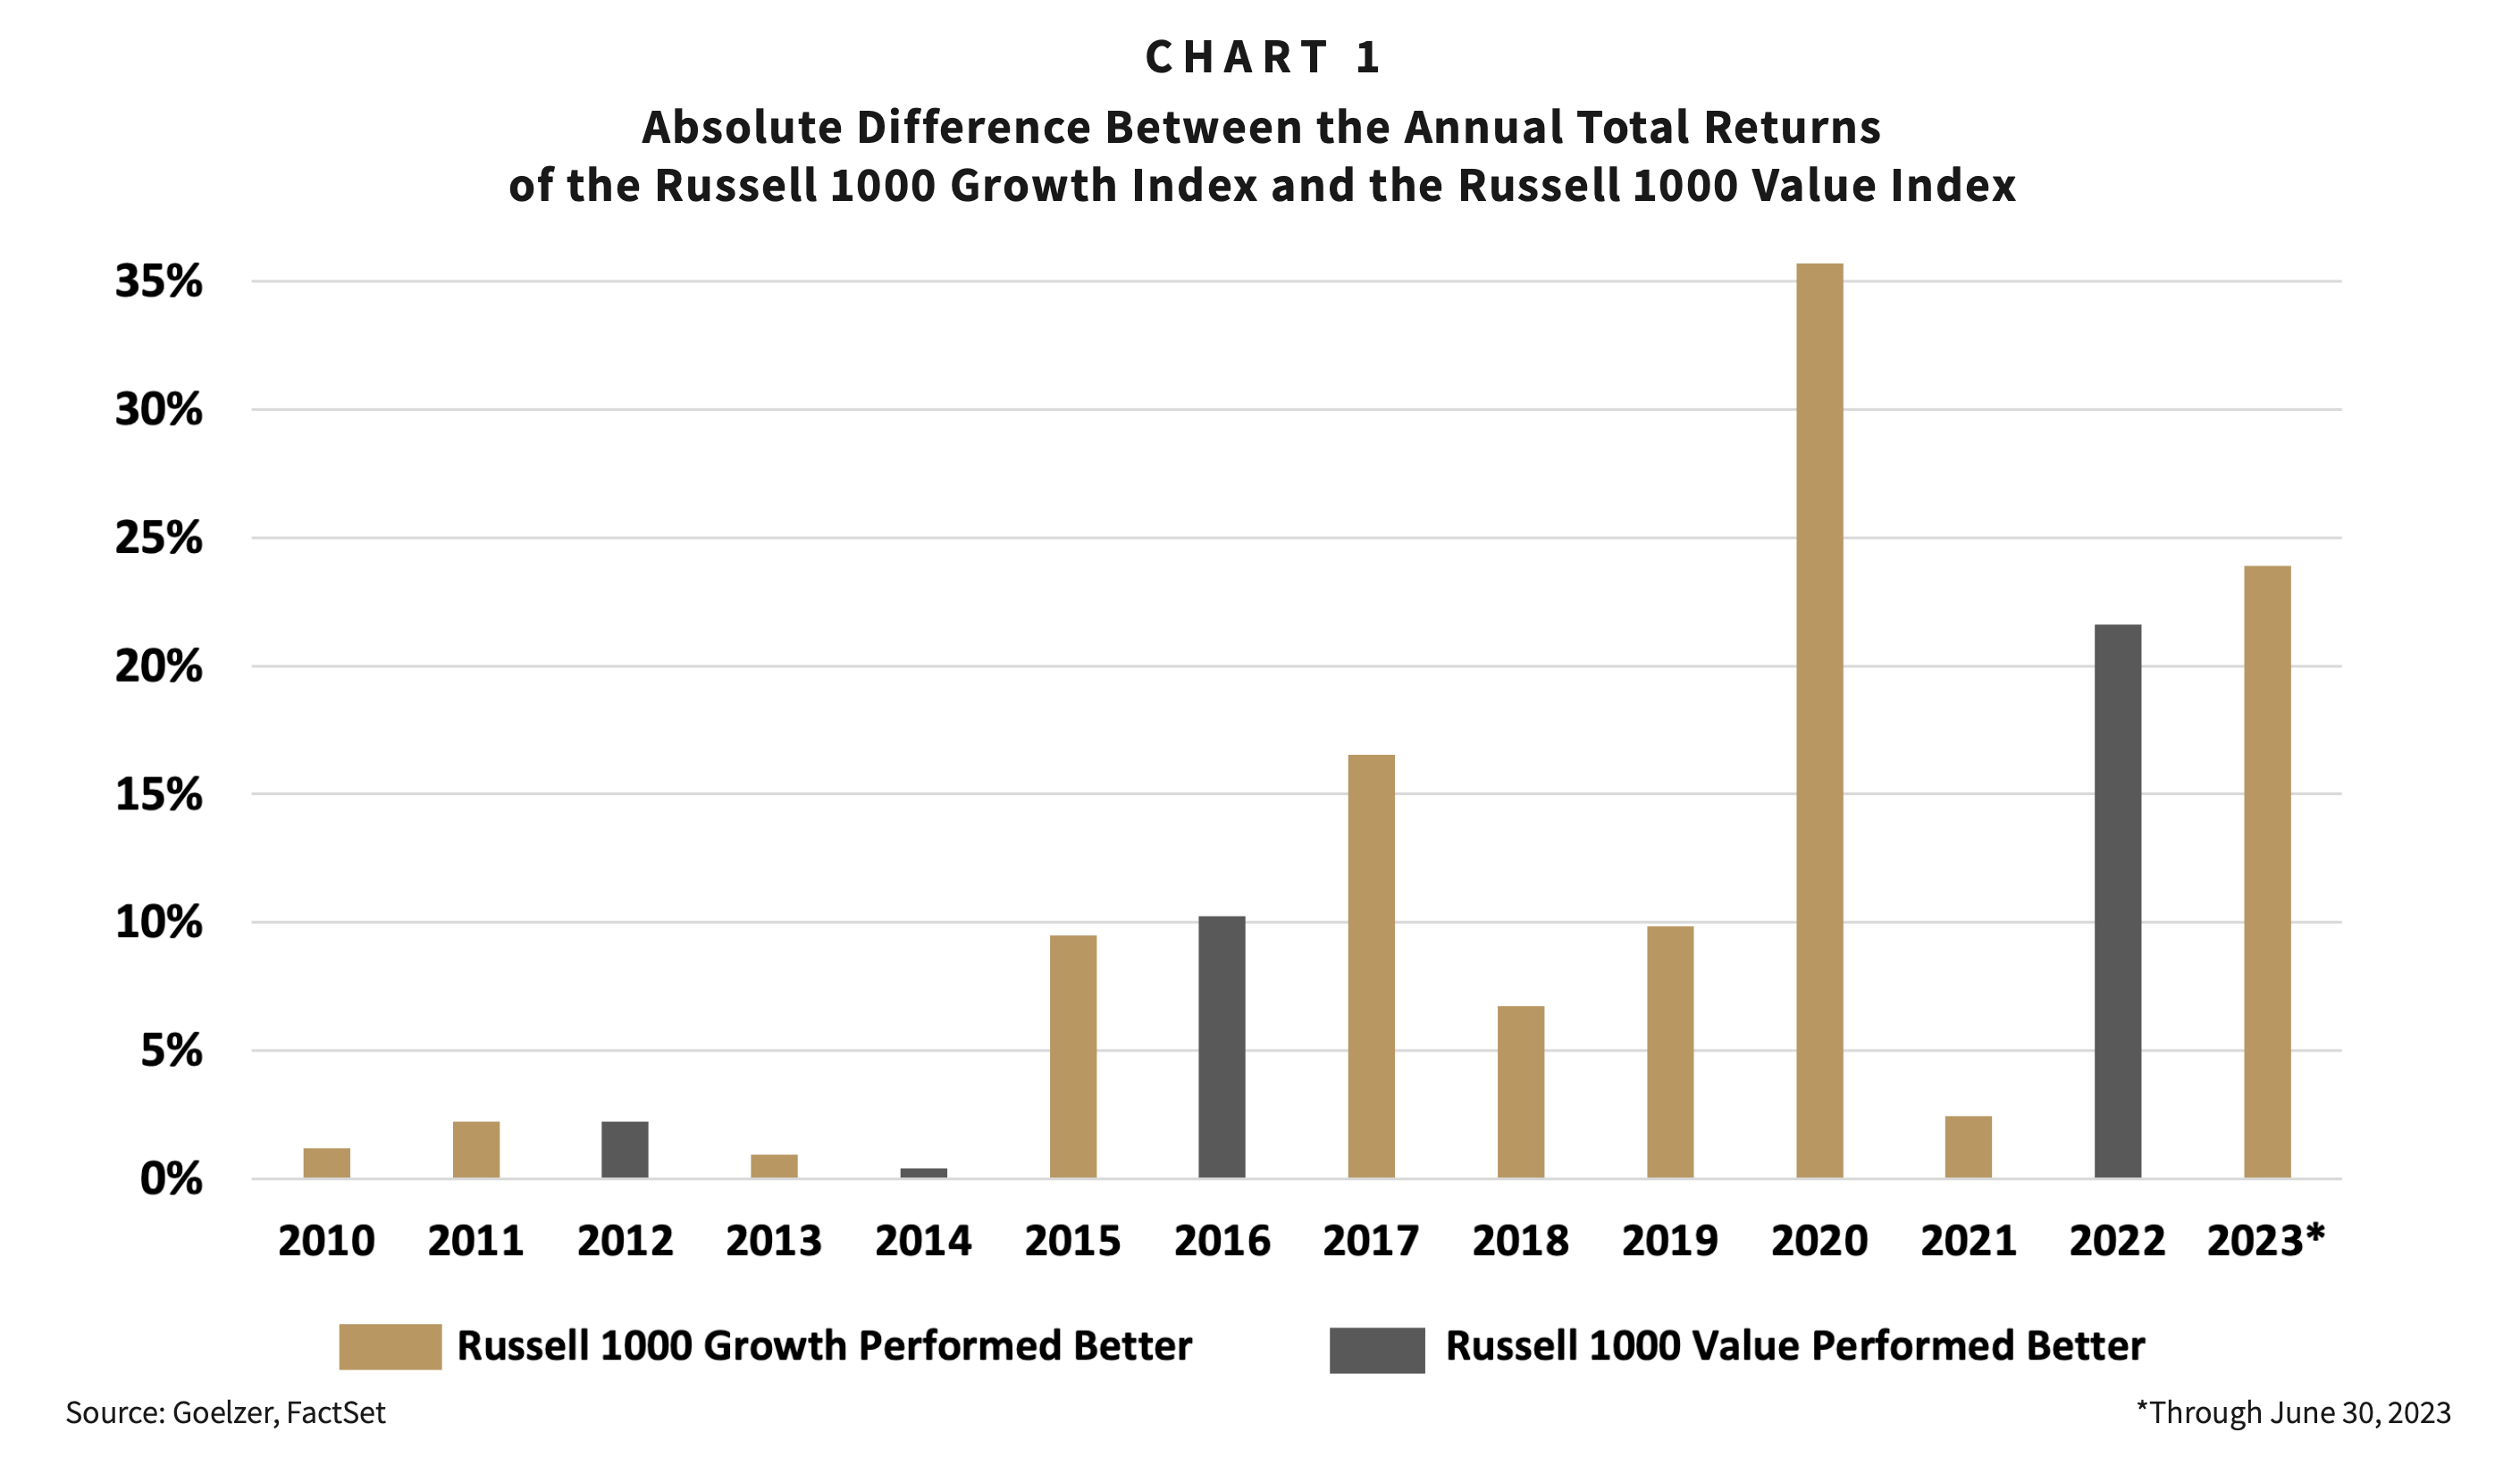
Chart 1 illustrates the increasing division between growth and value stocks by showing the absolute difference in the annual total returns of the Russell 1000 Growth Index and the Russell 1000 Value Index. From 2010 through 2014, there was little difference between the annual performance of the two indexes. However, beginning in 2015, that changed meaningfully. Since then, the amount of exposure investors had to growth versus value stocks has been a key determinant of performance, with most years favoring growth.
Also building in recent years is a growing share of major stock indexes populated by a small number of big growth-company stocks. Most of these major indexes used to measure the stock market’s performance weigh each of the member stocks by its market capitalization. Because of this, the portion of an index represented by the largest holdings can be many times that of the smallest holdings.
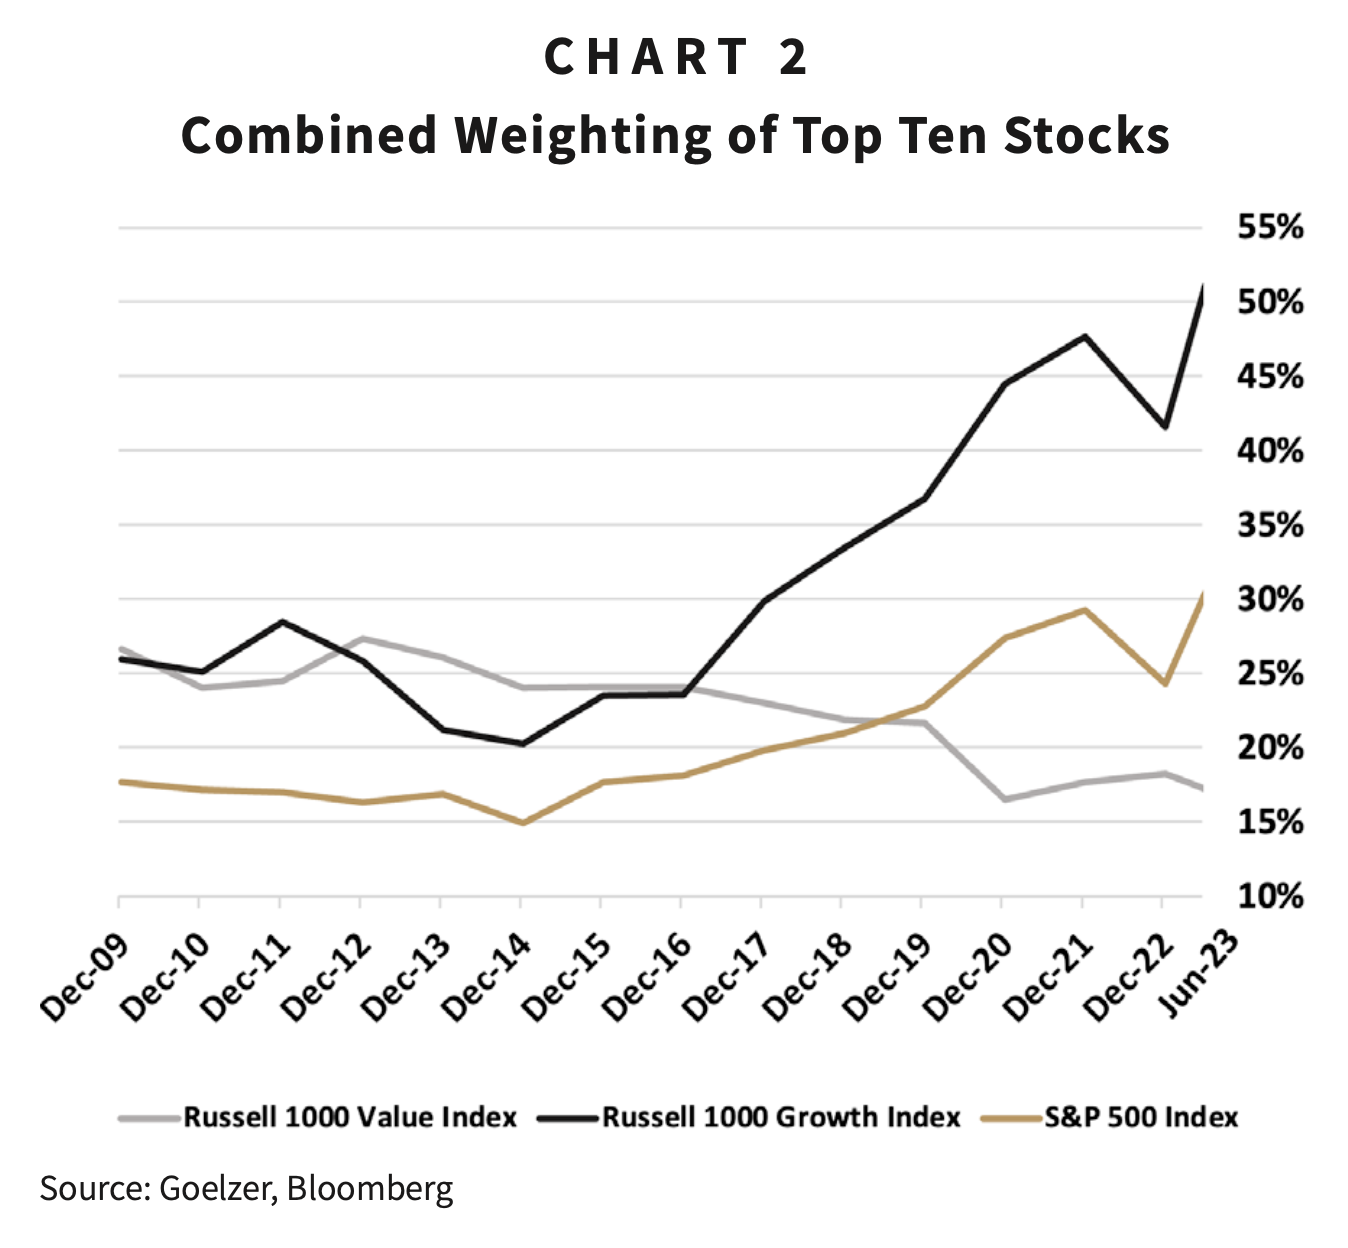
As shown in chart 2, the portion the S&P 500 Index represented by its ten largest holdings grew from 15% at the end of 2014 to 30% as of June. Further, growth stocks dominate this list of the largest holdings. In fact, eight of the ten largest holdings in the S&P 500 Index are also included among the Russell 1000 Growth Index’s ten largest holdings. And the Russell 1000 Growth Index is even more concentrated with its top-ten stocks representing 51% of its value as of June, up from just 20% at the end of 2014. This trend has left many investors increasingly exposed to the results of a small number of growth stocks, whether they realize it or not.
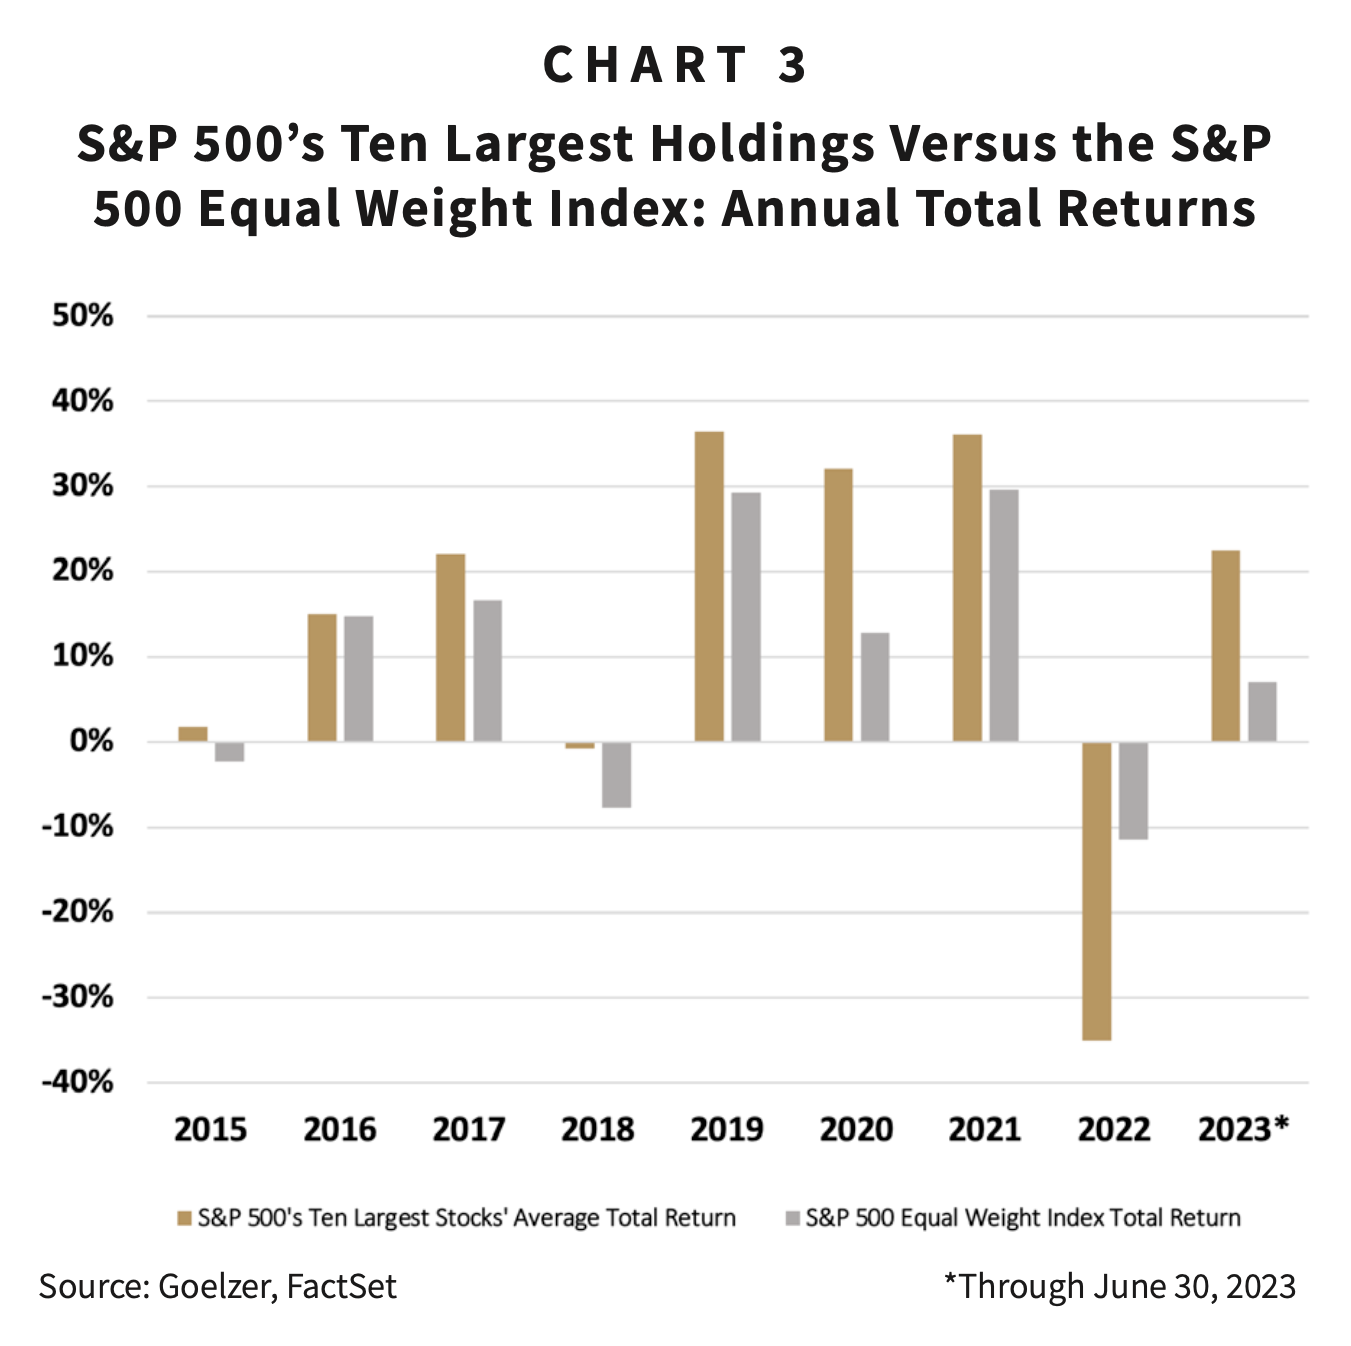
And as the ten largest stocks have grown to represent a much larger portion of those indexes, their performance has varied greatly with that of the average stock. Chart 3 shows the average annual total returns of the S&P 500 Index’s ten-largest holdings compared to those of the S&P 500 Equal Weight Index, which as the name implies, weighs each stock equally. Not only did the performance vary greatly between the largest stocks and the average stock, but collectively since 2015, the ten-largest stocks performed best in all but one year (2022).
Diversification is an important tool for investors wanting to manage risk. However, many investors’ portfolios have become less diversified as the exceptional recent performance of a few stocks leaves them more dependent on those same stocks for future returns. While the recent success of the stock market’s leaders can be enticing, in no way does it guarantee continued success. As the investment industry’s disclaimer says, “Past performance is no guarantee of future results.” In the case of the largest-company stocks, that is certainly true.
Consider, for example, that from one decade to the next, the stocks that made up the ten largest holdings in the S&P 500 Index regularly changed. This is due in part to the law of large numbers. As companies grow, it becomes difficult to maintain the same level of growth in percentage terms. A second challenge is maintaining the premium valuation that the top holdings often enjoy. Over time, the combination of slowing growth and lower valuations often causes the index’s largest holdings to underperform.
Looking back to the S&P 500 Index’s ten largest holdings at the end of 2012 attests to the difficult challenge of maintaining market beating performance. During the ten years that followed, only three of the ten stocks produced a better total return than the index and only two remained among the index’s ten largest holdings.
So, while the stock market’s narrow leadership could continue in the months ahead, it is unlikely to last longer term. Investors who maintain diversified portfolios, instead of chasing the most recent winners, will be well served when that change takes place.
1 Alphabet, Inc. class A and C shares combined as one.
2 Meta Platforms was moved from the Russell 1000 Growth Index to the Russell 1000 Value Index in June of 2022. It was moved back to the Russell 1000 Growth Index in June of 2023.
DISCLAIMER: The information provided in this piece should not be considered as a recommendation to buy, sell or hold any particular security. This report includes candid statements and observations regarding investment strategies, individual securities, and economic and market conditions; however, there is no guarantee that these statements, opinions, or forecasts will prove to be correct. Actual results may differ materially from those we anticipate. The views and strategies described in the piece may not be suitable to all readers and are subject to change without notice. You should not place undue reliance on forward-looking statements, which are current as of the date of this report. The information is not intended to provide and should not be relied on for accounting, legal, and tax advice or investment recommendations. Investing in stocks involves risk, including loss of principal. Past performance is not a guarantee of future results.
ABOUT GOELZER: With over 50 years of experience and more than $2.5 billion in assets under advisement, Goelzer Investment Management is an investment advisory firm that leverages our proprietary investment and financial planning strategies to help successful families and institutions Dream, Invest, and Live.
