
Chief Investment Officer | Principal


Investors continue to grapple with the consequences of an eventful March. We refer, of course, to the U.S. and Israel’s attack on the Republic of Iran and the evolving effects that have emerged since. For U.S. investors, those effects center on disruption in energy markets and the potential implications for consumer prices and economic growth. In this quarterly Insights, we address the market’s reaction to the war, the potential challenges that lie ahead, and the outlook for the U.S. economy and stock market moving forward.
Despite the launch of a major war in the Middle East, investors in U.S. stocks have reacted with considerable restraint. Through the end of the first quarter, U.S. large‑cap stock prices—as measured by the S&P 500 Index—declined by approximately 4%. The maximum drawdown during this period, from a peak reached on January 27, was 9%—a decline that is typical for U.S. investors in any year, let alone a year marked by war.1

Among the factors that appear to have limited the market’s decline is an expectation that disruptions to energy markets will be short‑lived. This expectation is evident in the pricing of oil futures. As Chart 2 shows, the U.S. oil market is priced for oil prices to move sharply lower in the months ahead. This structure, known as backwardation, exists when contracts for oil delivered further in the future are priced lower than near‑term contracts.
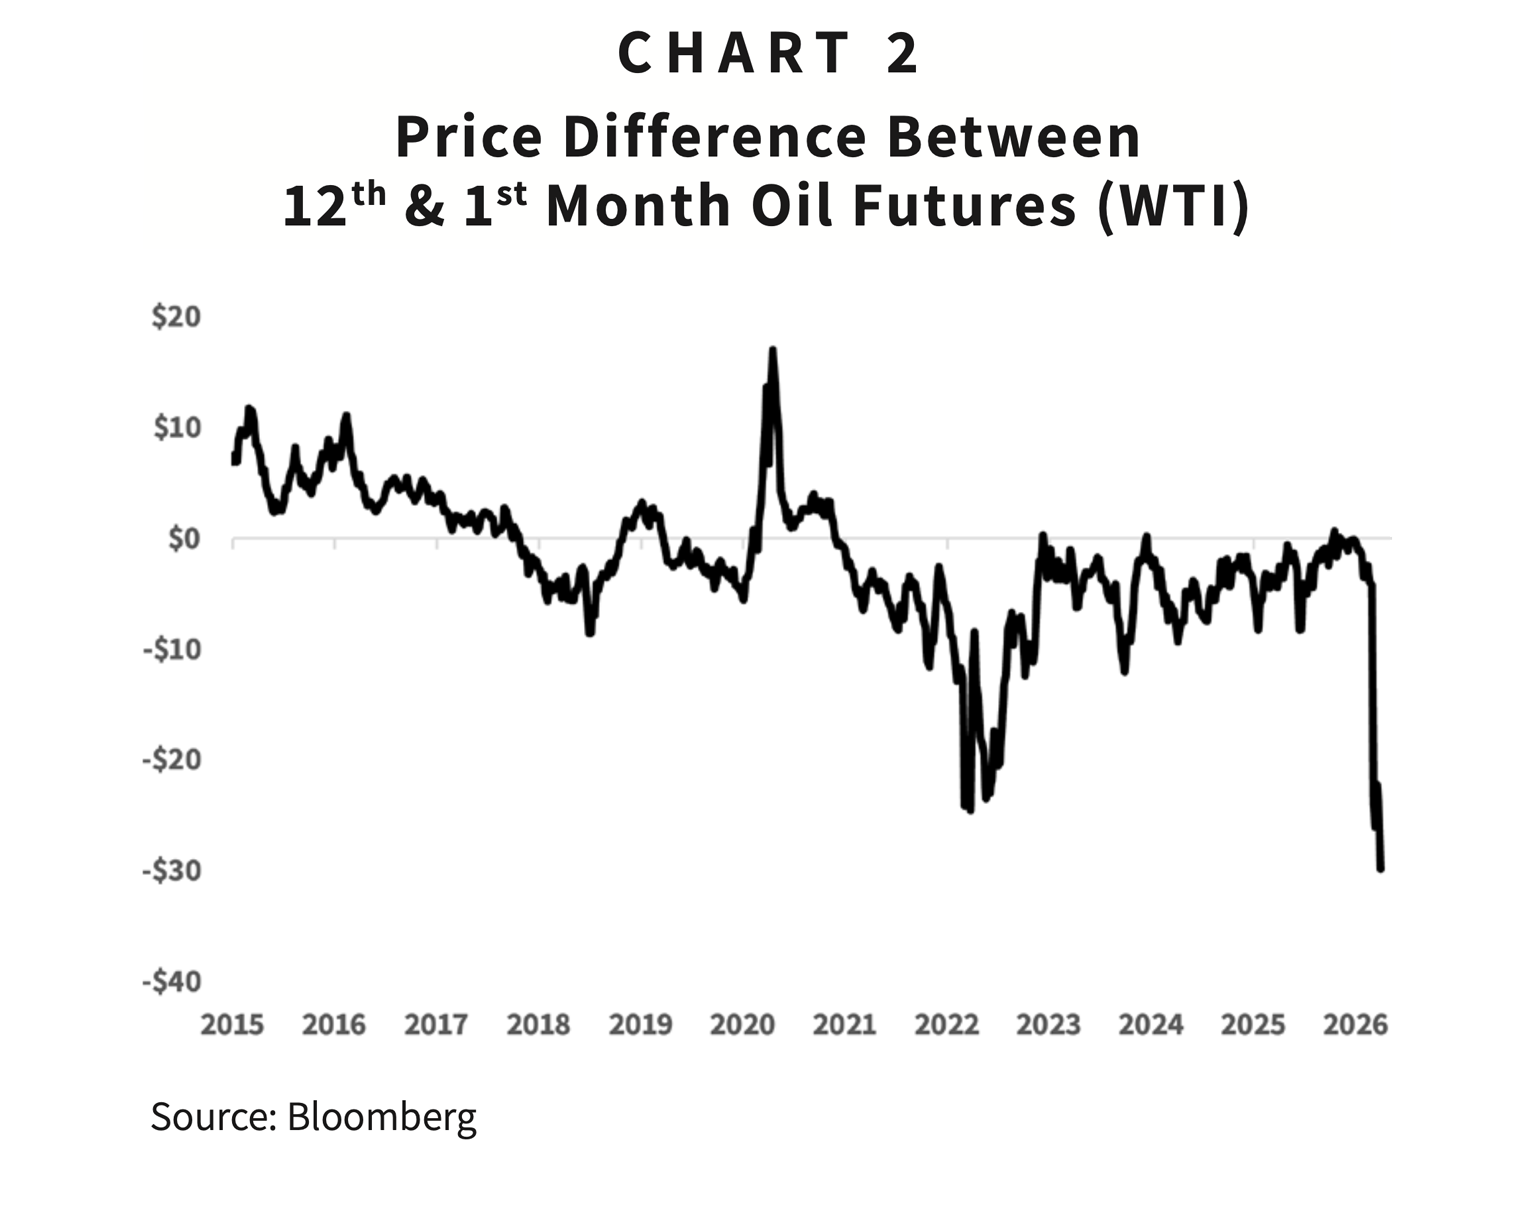
As of quarter‑end, a barrel of oil to be delivered 12 months ahead is priced roughly $30 below a barrel delivered one month into the future.2 The market, in other words, expects the recent spike in oil prices to be temporary—limiting the potential negative effects of higher energy prices on U.S. inflation and economic growth.
Unlike the market volatility that followed last spring’s tariff‑policy announcements, the consequences of last month’s attacks may not be resolved as quickly. First, as widely reported, the Strait of Hormuz—a critical chokepoint through which roughly 20% of the world’s oil supply typically passes, much of it destined for Asia—is effectively closed. Prior to the conflict, more than 100 oil and refined‑fuel vessels transited the strait each day; today, only a handful can pass through this vital corridor.3
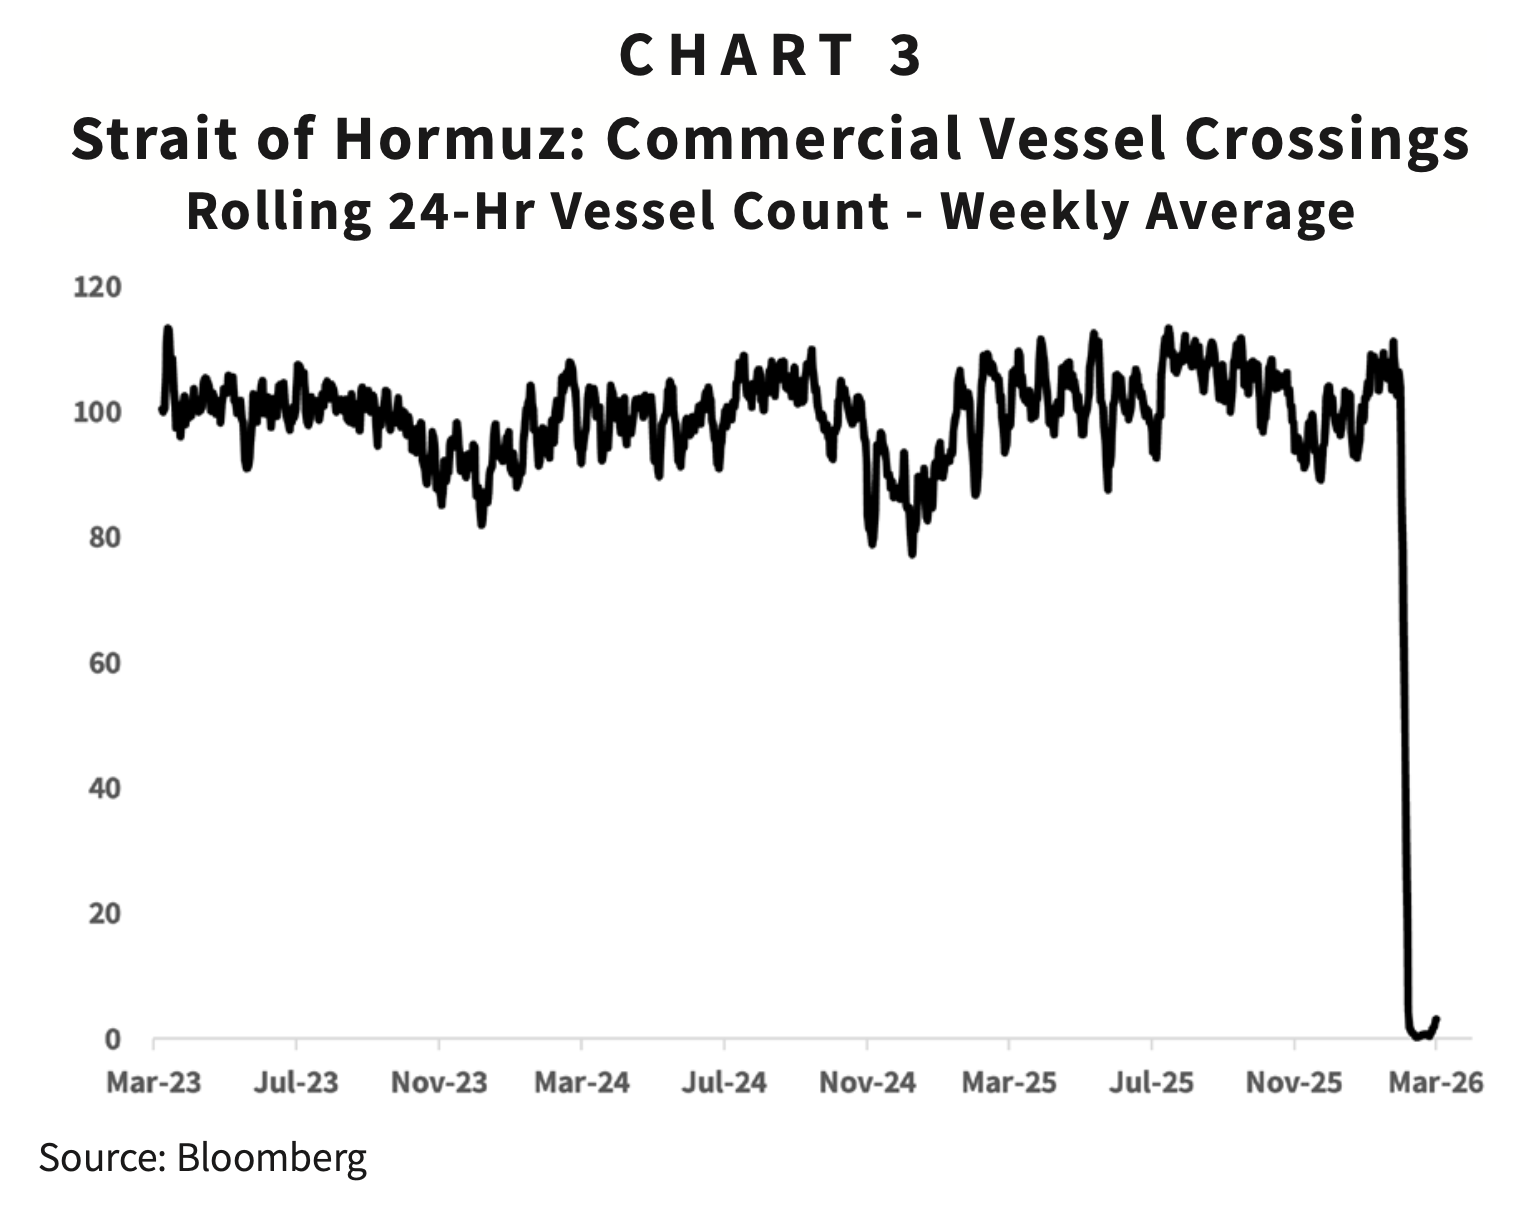
While it remains to be seen whether the Iranian regime will continue to strike vessels in the strait, even the threat of attack is likely to deter shipping activity. As a result, a return to pre‑war traffic levels appears unlikely for an extended period. Countries heavily dependent on imported oil and natural gas now face a heightened risk of sustained energy price increases—intensifying near‑term inflation pressures and weighing on economic growth. As energy costs rise, households and businesses are forced to allocate a greater share of spending toward fuel and power, crowding out other consumption and investment.
Additionally, resolution of the hostilities—and the associated energy and economic disruption—depends on multiple parties, not solely the United States. Chief among them is the Iranian regime, whose overriding priority of self‑preservation complicates the prospects for a rapid truce. Should Iran follow through on threats to attack surrounding countries’ energy infrastructure or desalination facilities, other Gulf nations could be drawn into the conflict, resulting in even broader disruption to global energy markets. Such a development would challenge the market’s current expectation of a swift resolution and could lead to a prolonged period of uncertainty, particularly around energy prices and inflation expectations.
What may appear to be an incongruent market reaction to a complex and escalatory war becomes more understandable when viewed in the context of the U.S. economy and corporate earnings. While rising oil prices pose immediate and longer‑lasting risks to inflation and growth, those effects should be felt less acutely in the United States than in countries more dependent on imported energy.
In the 1970s, the U.S. imported roughly 40% of its oil, and consumers spent more than 10% of disposable income on gasoline. Today, the U.S. is the world’s largest producer of oil and natural gas, and consumers spend an average of just 2–3% of disposable income on gasoline. These dynamics will not prevent domestic energy prices from rising—oil is, after all, a global market—but the U.S.’s dominant position as an energy producer should help limit the impact relative to other regions and contain the potential drag on domestic spending.
In addition, despite the challenges outlined above, the outlook for U.S. corporate earnings is improving. Since the outbreak of the war, earnings estimates for U.S. large‑capitalization companies have continued to rise. Importantly, this improvement is no longer confined to the largest technology companies that have dominated returns in recent years.
As Chart 4 shows, companies within the market‑capitalization‑weighted S&P 500 are expected to grow earnings over the next 12 months at a year‑over‑year rate of roughly 16%—nearly twice the average earnings growth rate of the past 20 years. While earnings growth among the largest companies has been strong for several years, the outlook is now improving more broadly. This is evident in rising earnings expectations for the S&P 500 Equal‑Weight Index, which reduces the influence of the market’s largest constituents.4 Investors are increasingly expecting stronger earnings from the energy sector, as well as from companies positioned to benefit not only from the production of artificial intelligence but also from its application across business models. A growing and broadening outlook for U.S. corporate earnings has helped limit the stock market’s downturn and offers encouragement for potential returns moving forward.

In an environment shaped by both geopolitical risk and technological opportunity, we return to a core tenet of the firm’s investment philosophy: Invest in a manner that makes time your friend, and more time a better friend. While the near term may prove more risk‑laden than the stock market currently expects, meaningful reasons for optimism remain. Those with the patience to let time work in their favor stand to benefit.
1 Bloomberg, S&P 500. Total return through March 31, 2026. Drawdown calculated from January 27 through March 30, 2026. Calendar-year return and drawdown chart adapted from J.P. Morgan’s Guide to the Markets.
2 Bloomberg, Generic 1st and 12th ‘CL’ Future, prices as of April 1, 2026.
3 Bloomberg, Vessel Tracker, function IMO , Data through March 31, 2026, includes bidirectional traffic.
4 Bloomberg, earnings estimates for the next 12 months compared to prior 12 months. Estimates as of April 1, 2026.
DISCLAIMER: The information provided in this piece is not intended as a recommendation to buy, sell, or hold any particular security. This report includes statements and observations regarding investment strategies, individual securities, and economic and market conditions; however, there is no guarantee that such statements, opinions, or forecasts will prove to be correct, and actual results may differ materially. The views and strategies discussed may not be suitable for all readers and are subject to change without notice. Statements, estimates, and projections included herein may constitute forward-looking information and should not be relied upon as guarantees of current or future results. Investing in stocks involves risk, including the potential loss of principal, and past performance is not a guarantee of future results. The information provided is not intended to offer, and should not be relied upon for, accounting, legal, tax, or investment advice. You cannot invest directly in an index. For full firm disclosures, visit goelzerinc.com/compliance.
ABOUT GOELZER: With over 50 years of experience and more than $4 billion in assets under advisement, Goelzer Investment Management is an investment advisory firm that leverages our proprietary investment and financial planning strategies to help successful families and institutions Dream, Invest, and Live.
