
Senior Portfolio Analyst


 Throughout history, a small group of companies or sectors has periodically dominated U.S. equity markets. Each cycle follows a similar arc: concentration rises quickly around a major innovation theme, peaks, and then declines. Historical peaks include railroads (~63% in the late 1800s), utilities and industrials (~36% in the early 20th century), the Nifty Fifty (~40% in the early 1970s), Japan (~44% in the late 1980s), and TMT (~41% in the late 1990s). Notably, after the TMT peak, the top ten stocks’ share fell by roughly half within five years, illustrating how quickly leadership can reverse.
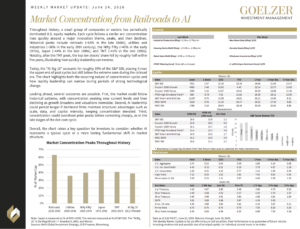
Today, the “AI Big 10” accounts for roughly 39% of the S&P 500, placing it near the upper end of past cycles but still below the extreme seen during the railroad era. The chart highlights both the recurring nature of concentration cycles and how rapidly leadership can narrow during periods of strong technological change.
Looking ahead, several outcomes are possible. First, the market could follow historical patterns, with concentration peaking near current levels and then declining as growth broadens and valuations normalize. Second, AI leadership could persist longer if dominant firms maintain structural advantages such as scale, data, and capital intensity, keeping concentration elevated. Third, concentration could overshoot prior peaks before correcting sharply, as in the late stages of the dot-com cycle.
Overall, the chart raises a key question for investors to consider: whether AI represents a typical cycle or a more lasting fundamental shift in market structure.
Weekly Market Update: June 24, 2026
