
Chief Investment Officer | Principal


Each year, we update our long-term market forecasts, producing both 10-year and 30-year return estimates. We use proprietary models for the 10-year outlook and a combination of Goelzer models and historical returns for the 30-year view. Alongside return forecasts, we provide a range of outcomes for each asset class, based on historical volatility of valuation measures.
Our goals:
While offering reasonable return expectations is critical, ranking risk-adjusted return projections for each asset class is even more important for building strategic allocations. Our forecasts have not always been perfect—whose have?—but they have been reasonably accurate at projecting future returns and ranking asset classes.1
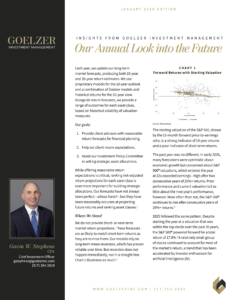
We do not provide short- or near-term market return projections. These forecasts are as likely to match short-term returns as they are to miss them. Our models rely on long-term mean reversion, which has proven reliable over time. But reversion does not happen immediately, nor in a straight line. Chart 1 illustrates as much.2
The starting valuation of the S&P 500, shown by the 12-month forward price-to-earnings ratio, is a strong indicator of 10-year returns and a poor indicator of short-term returns.
The past year was no different. In early 2025, many forecasters were optimistic about economic growth but concerned about S&P 500® valuations, which entered the year at 22x expected earnings—high after two consecutive years of 25%+ returns. Prior performance and current valuation tell us little about the next year’s performance, however. More often than not, the S&P 500® continues to rise after consecutive years of 20%+ returns.3
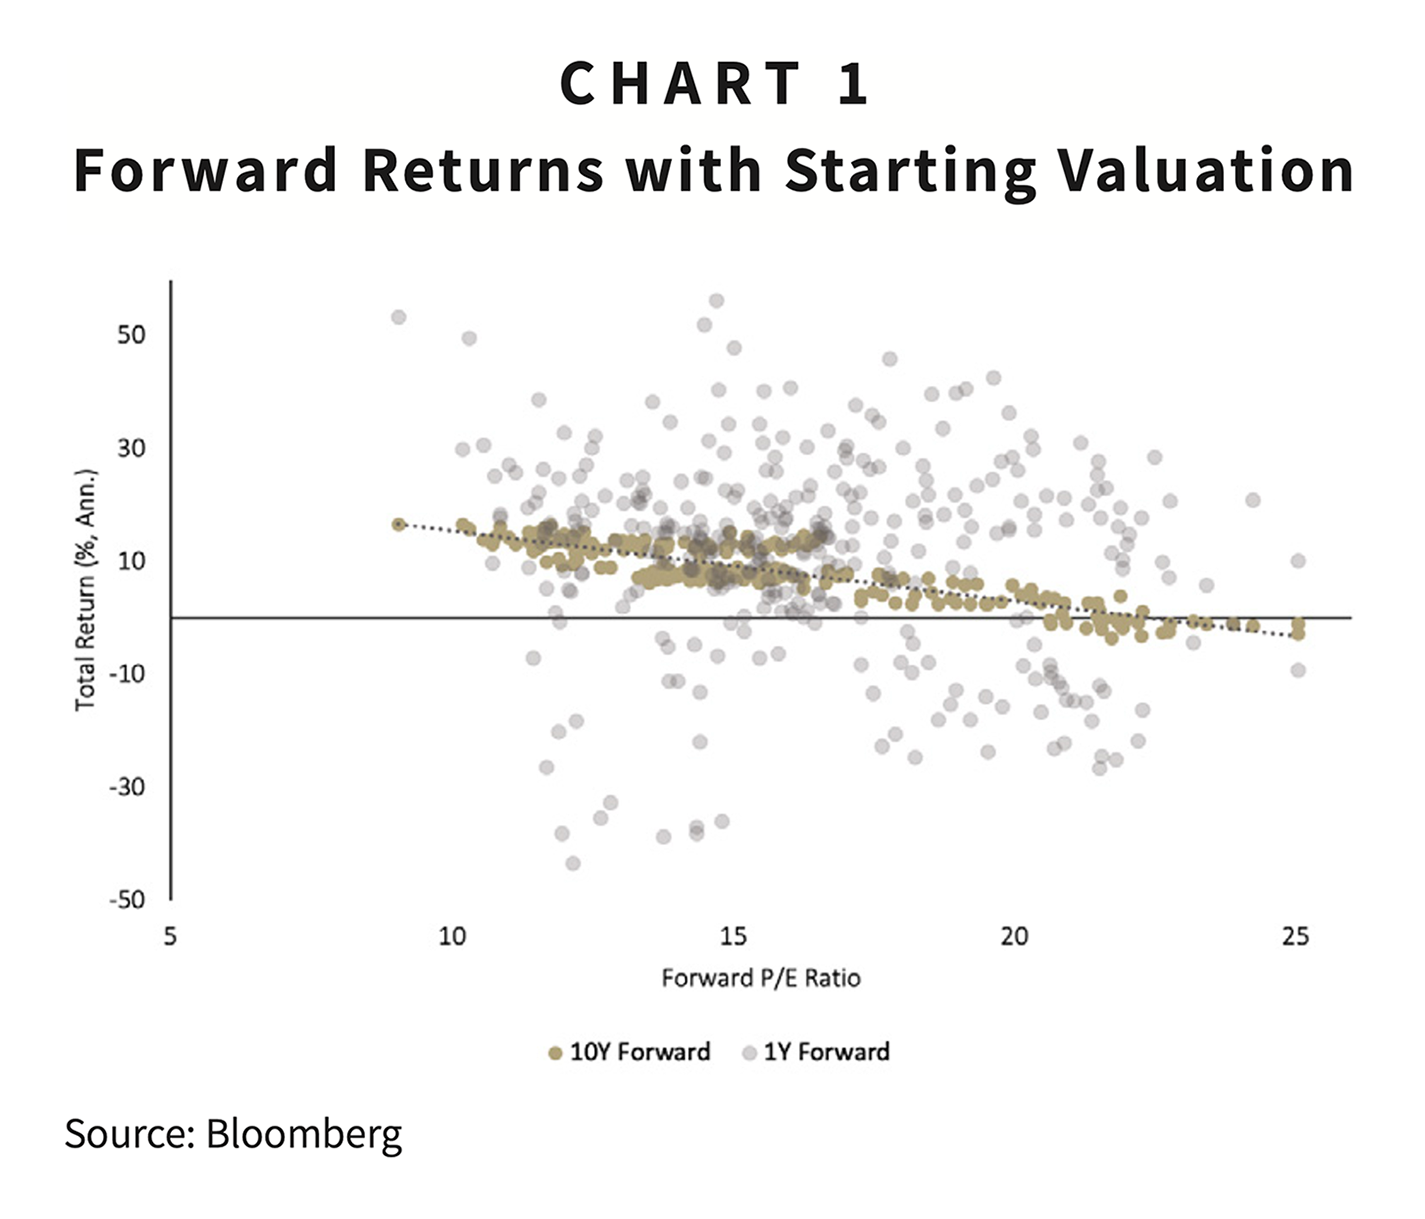
2025 followed the same pattern. Despite starting the year at a valuation that was within the top decile over the past 30 years, the S&P 500® powered forward for a total return of 17.8%.4 A relatively small group of stocks continued to account for most of the market’s return, a trend that has been accelerated by investor enthusiasm for artificial intelligence (AI).
While leadership expanded slightly in 2025, the top 10 performing stocks accounted for 49% of the U.S. large-cap stock market’s total return.5
Another strong year of market returns leaves stocks generally expensive, thus limiting our expected returns moving forward. This is especially evident for U.S. large-cap growth stocks, which have benefited from investors’ focus on all things related to AI.

As Chart 3 shows, most equity markets have valuations that rest toward the higher end of their historical distributions.6 Only U.S. small-cap stocks are valued at the lower end, thus providing potential return support.
It should be no surprise at this point that our 2026 capital markets expectations (CMEs) indicate lower returns over the next 10 years than the past decade. Indeed, it has been an extraordinary run for U.S. large-cap stocks (14.8% annualized) and U.S. large-cap growth stocks (18.1% annualized) in particular.7 As a result, both markets begin another year with valuations near the 90th percentile of 30-year range, which likely limits their forward return potential.8
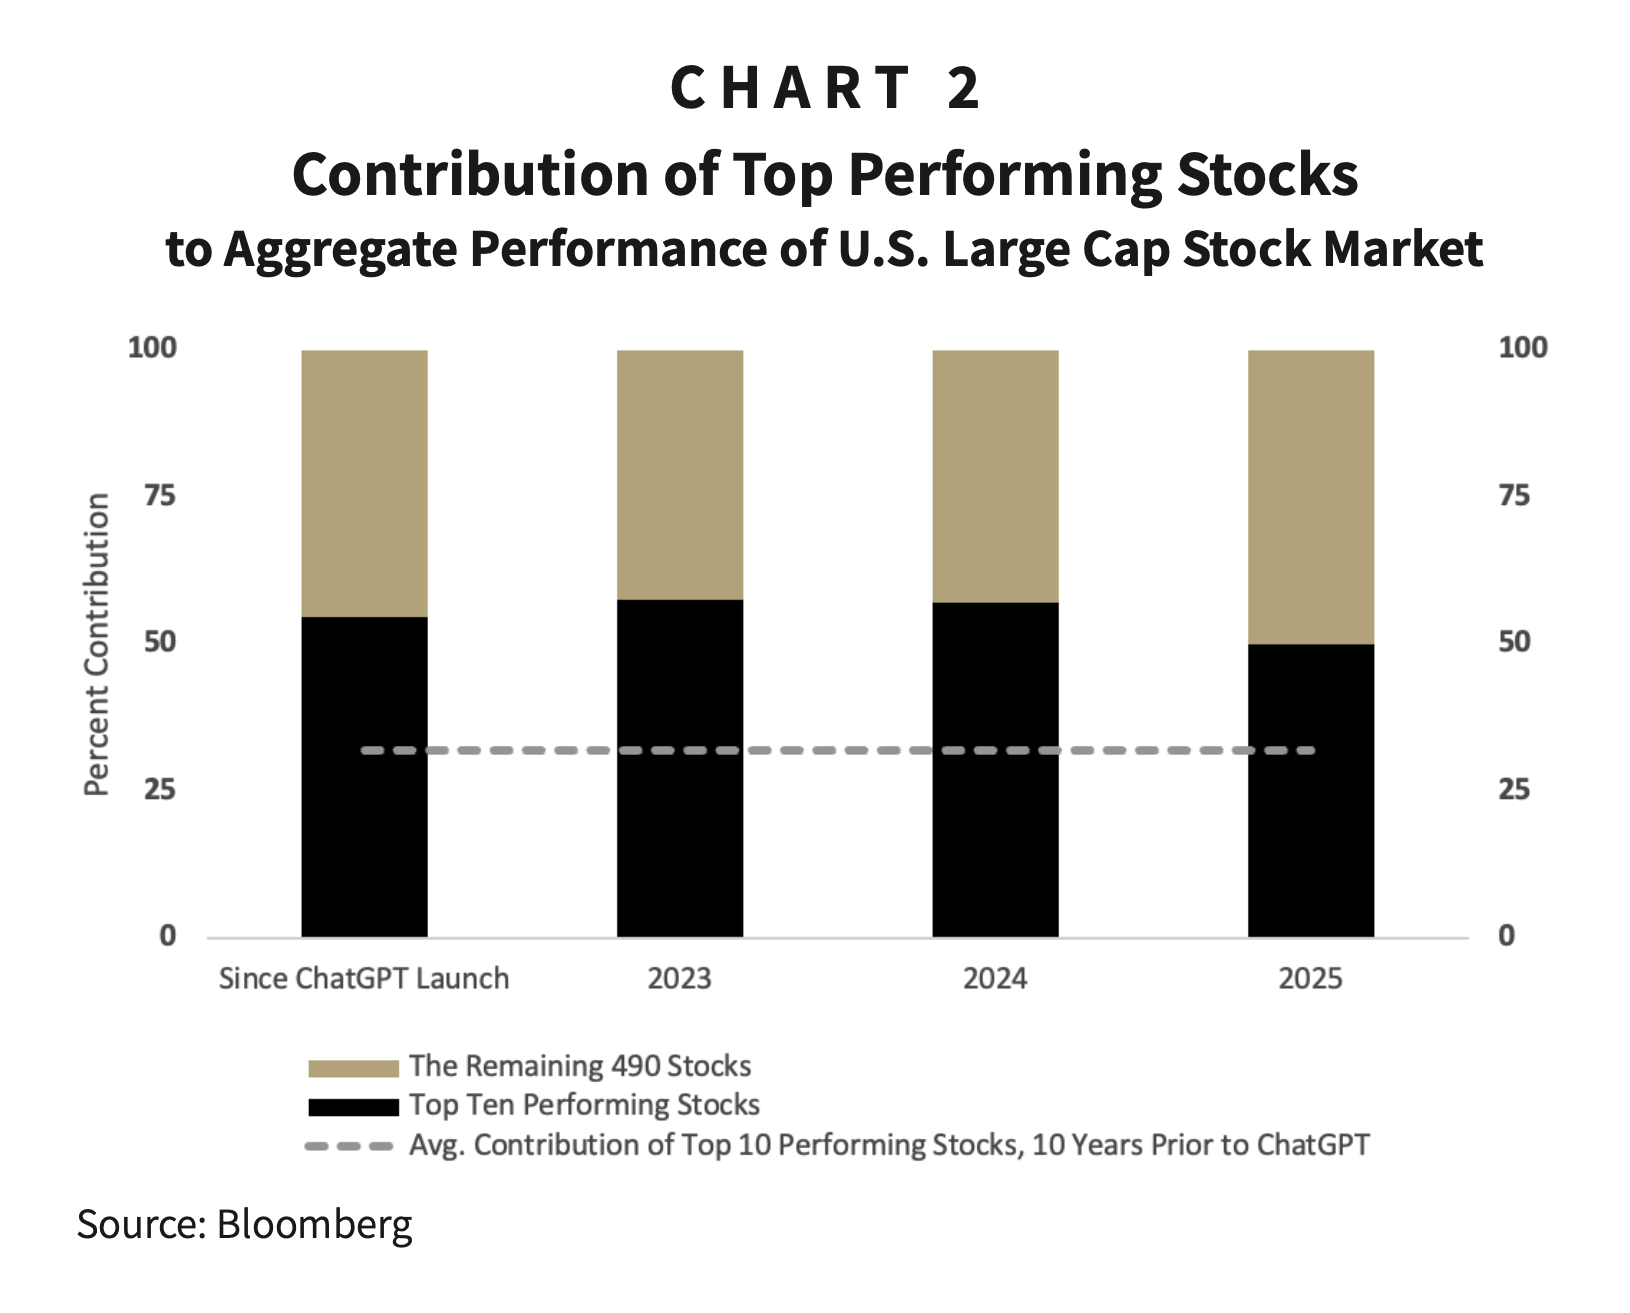
Our models indicate expected returns of 3% to 6% for U.S. large-cap stocks as a whole and 1% to 6% for U.S. large-cap growth stocks in particular. These numbers account for an increase in projected earnings growth, which has been supported by changes in tax policy and margin expansion.9
While our expectations for U.S. growth stocks are subdued, we continue to see higher long-term opportunities in U.S. value stocks, many of which have been neglected by investors focused on AI. Small and mid-cap U.S. stocks continue to appear attractive relative to larger company stocks but come with added volatility. And despite a remarkable year in international (ex-U.S.) stock returns, we still see opportunities in both developed and emerging markets due to both reasonable starting valuations and modest improvement in earnings growth.10
Outside of stocks, our models point to solid returns from fixed income, buoyed by yields that are higher than their 30-year averages.11 Higher starting yields and the prospect of lower short-term rates also support our forecasts for alternative assets, especially private real estate and private credit. In addition to their return potential, alternative investments serve as potential diversifiers, arguing for a dedicated allocation within suitable portfolios, particularly those of sufficient size and built for long time horizons.
The past three years of strong performance for the S&P 500® Index leaves us with modest expectations for 10-year forward returns on U.S. large-cap stocks. Prospects appear brighter in other areas of the market such as U.S. small-cap stocks and international stocks. So why not allocate more aggressively to those sectors with the highest expected returns? In a word: risk.
As mentioned above, our CMEs include a range of outcomes based on the historical volatility of each asset class. An asset class with higher volatility may indicate a relatively high expected return, but also a wider range of potential outcomes. As a result, the actual return of that more volatile asset class may prove lower than an asset class with a lower expected return, yet a narrower range of outcomes. In addition, asset classes with lower expected returns may prove as important portfolio diversifiers, potentially contributing to portfolio stability and providing resources to opportunistically rebalance portfolios in volatile markets.
Finally, we note that these forecasts are based on a single point. As the months and years unfold, markets will fluctuate. And as they do, our forecasts will adapt with them, identifying new investment opportunities along the way. Those investors with soundly constructed portfolios, well-crafted investment plans—and the discipline to act on them—stand to benefit.
1 Our models have exhibited an average hit rate of 56% over four sample periods (2000, 2005, 2010, and 2015), indicating that actual asset-class returns fell within our expected ranges. The rank rate, which indicates whether our rankings of expected returns were accurate, was higher at an average of 76%.
2 Bloomberg, forward price-to-earnings ratio, monthly observations December 31, 1995 through December 31, 2024. Returns are total returns.
3 See our Insights from one year ago: “Our Annual Look into the Future.” Prior to 2025, the average calendar-year performance following two years of consecutive calendar-year returns over 20% was 9.7%.
4 Bloomberg. Valuations based on forward price-to-earnings ratios from December 31, 1995 through December 31, 2025, quarterly observations.
5 Bloomberg U.S. 500 Total Return Index. ChatGPT launch was November 30, 2022. Returns since that period are annualized.
6 12-month forward price-to-earnings ratios, monthly observations from December 31, 1995 through December 31, 2025. Ranges are two standard deviations above and below the 30-year average forward price-to-earnings ratios. Source: Bloomberg. Indexes include S&P 500®, Russell 1000 Growth, Russell 1000 Value, S&P Mid Cap, S&P Small Cap, and ACWI ex-U.S.
7 Bloomberg, S&P 500 and Russell 1000 Growth. Total returns, annualized, through December 31, 2025.
8 At 22.1x forward earnings, the S&P 500’s valuation sits at the 94th percentile in quarterly observations since 1995. The Russell 1000 Growth, at 28.6x its forward earnings estimates, sits at the 89th percentile of 20-year quarterly observations.
9 The lowering of corporate taxes in 2017 Tax Cuts and Jobs Act—and their extension in 2025’s One Big Beautiful Bill Act—have helped drive corporate profit margins higher in recent years. Our models account for this inflection in earnings growth by projecting forward earnings growth among U.S. large-cap stocks of 7.7%, which represents an acceleration from a historical average of about 6% over the past 30 years.
10 Developed market stocks (excluding the U.S.) have benefited from a moderate improvement in earnings growth, which we model at 4.5% over the next 10 years.
11 Bloomberg. The 30-year average yield of the 10-year Treasury bond, through December 31, 2025, was 3.66%. The 10-year Treasury ended 2025 with a yield of 4.17%. The 30-year average yield-to-worst of the Bloomberg U.S. Aggregate Bond Index, through December 31, 2025, was 4.08%. The index ended 2025 with a yield-to-worst of 4.32%.
DISCLAIMER: The information provided in this piece is not intended as a recommendation to buy, sell, or hold any particular security. This report includes statements and observations regarding investment strategies, individual securities, and economic and market conditions; however, there is no guarantee that such statements, opinions, or forecasts will prove to be correct, and actual results may differ materially. The views and strategies discussed may not be suitable for all readers and are subject to change without notice. Statements, estimates, and projections included herein may constitute forward-looking information and should not be relied upon as guarantees of current or future results. Investing in stocks involves risk, including the potential loss of principal, and past performance is not a guarantee of future results. The information provided is not intended to offer, and should not be relied upon for, accounting, legal, tax, or investment advice. You cannot invest directly in an index. For full firm disclosures, visit goelzerinc.com/compliance.
ABOUT GOELZER: With over 50 years of experience and more than $4 billion in assets under advisement, Goelzer Investment Management is an investment advisory firm that leverages our proprietary investment and financial planning strategies to help successful families and institutions Dream, Invest, and Live.
